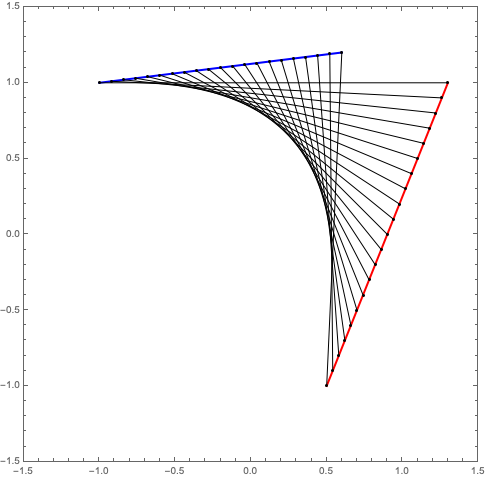
Building on my last post, here is another way to construct a parabola using a collection of straight lines. First, the description, taken from Lockwood’s A Book of Curves (page 7):
Draw any two lines and mark on each a series of points at equal intervals. (The intervals on the second line need not be equal to those on the first.) Call the points on the first line \(A_1, A_2, A_3\), etc., and those on the second line \(B_1, B_2, B_3\), etc. Join \(A_1 B_1, A_2 B_2, A_3 B_3\), etc. The envelope of these lines will be a parabola.
I won’t go through the construction step-by-step as I did before. Here is the final Mathematica code:
line1 = {{-1.0, 1.0}, {0.6, 1.2}};
line2 = {{1.3, 1.0}, {0.5, -1.0}};
box = 1.5;
numberOfPoints = 20;

makePoints[line_] := Module[{},
   xStart = line[[1, 1]];
   xEnd = line[[2, 1]];
   yStart = line[[1, 2]];
   yEnd = line[[2, 2]];
   xStep = (xEnd - xStart)/numberOfPoints;
   yStep = (yEnd - yStart)/numberOfPoints;
   Table[{xStart + i*xStep, yStart + i*yStep}, {i, 0, numberOfPoints}]];

Graphics[
 {
  {Blue, Thick, Line[line1]},
  {Red, Thick, Line[line2]},
  {Black, Point[makePoints[line1]]},
  {Black, Point[makePoints[line2]]},
  Line /@ Transpose[{makePoints[line1], makePoints[line2]}]
  }, PlotRange -> {{-box, box}, {-box, box}},
 Frame -> True]
The result:

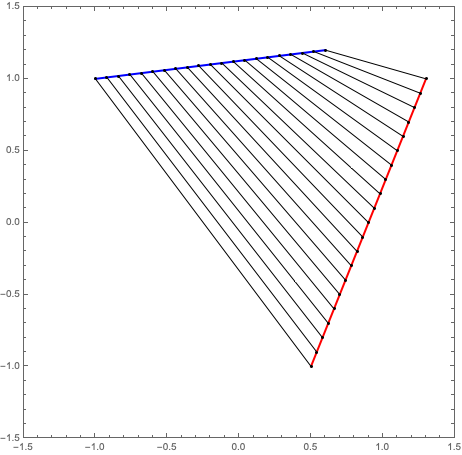
The instructions given above for the construction are not quite complete. The order in which the points are joined matters. To see this, switch the order of the two points in line2 in the above code, so line2 = {{0.5, -1.0}, {1.3, 1.0}};. The result:

Definitely not a parabola!